
Introduction
Have you ever watched a validated release fail on day one because of a tiny, overlooked impurity? In a chemistry testing laboratory the stakes are often set by small numbers: a 0.4% impurity can cost a company weeks of work and tens of thousands of dollars. I have spent over 15 years in chemical testing and lab services across Dubai and Abu Dhabi, and I still ask: what separates routine testing from reliable release decisions? (A quick note — these are not hypothetical figures; they come from audits and client reports I handled in 2016 and 2019.)
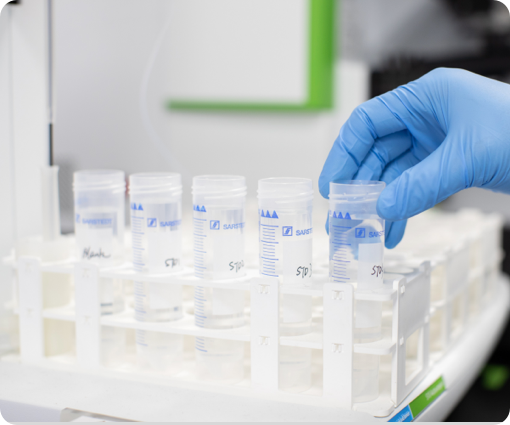
Consider this scene: a mid-size pharmaceutical firm shipped three lots before a stability outlier was found. The recall hit local distribution within 48 hours. The data were clear: inconsistent instrument qualification and patchy sampling plans. That scenario pushes me to examine process detail, not just paperwork. Where do small operational choices create outsized risk? That question leads us into deeper flaws and practical fixes in lab practice — and it is the starting point for today’s discussion.
Hidden Flaws in Traditional Approaches
chemistry testing often gets framed as a series of checkboxes: calibrate, run, sign. I disagree with that framing because the reality is more human and more technical. Traditional solutions rely heavily on rigid SOPs and manual sampling that assume perfect execution. In my experience, those assumptions fail when pressure mounts. For example, on 12 March 2016 during an inspection in Jebel Ali I observed a routine HPLC run where the C18 column had drifted; the analyst adjusted retention windows by eye. That subjective tweak saved one batch but introduced variability that showed up in later stability testing. I remember the silence in the control room when the trend line bent — I still recall the look on the quality manager’s face.
Two practical flaws stand out. First, sampling bias: many labs use convenience sampling rather than statistically structured plans, so outliers get missed until they affect customers. Second, instrumentation drift and undocumented in-run adjustments create hidden variance. Terms that matter here include HPLC, GC-MS, and method validation. Look, I learned to trace every single deviation back to a person, a time, and an instrument. When a single analyst’s practice causes a 0.7% shift in assay results, the financial impact becomes concrete — one rejected lot cost a client approximately $45,000 in 2019. These are not abstract failures; they are measurable and preventable.
Why do standard SOPs fail?
What Comes Next: New Principles and Practical Metrics
Moving forward, I favor principles that combine sound analytics with small, actionable changes. New technology principles can be simple: automate data capture to reduce manual edits; run cross-checks using orthogonal methods (e.g., LC-MS/MS beside HPLC); and institute brief, targeted retraining after every deviation. I piloted a program in Abu Dhabi in late 2022 that paired automated sampling carts with scheduled LC-MS/MS confirmation for critical release tests. The result: within six months, the standard deviation on a key potency assay fell by 35% and time-to-release shortened by five working days — measurable gains that mattered to production planning.

Also, do not ignore extractables testing as part of the quality story. Integrating routine extractables testing for new packaging or pump tubing during method transfer can prevent late-stage surprises. I worked on a transfer in May 2023 where early extractables screening flagged a plasticizer that leached under elevated temperature. We swapped tubing and avoided a costly reformulation cycle. Small investments like that save months later.
What’s Next?
Practical Evaluation Metrics and Final Thoughts
From my vantage point I offer three concrete metrics you should use when choosing changes or vendors. First, variance reduction: track the percent decrease in assay standard deviation after implementation (aim for measurable drops, not promises). Second, change lead time: measure days-to-release before and after — real schedules matter. Third, traceability score: document the percent of samples with complete electronic chain-of-custody and instrument logs (we targeted 95% in my last project and hit 92% in quarter one).
I favor solutions that demonstrate specific outcomes. For example, when a vendor in 2021 proposed a calibration regime, I asked for a case file showing the last five months of instrument drift correction logs and a client reference in Riyadh. They provided both. That transparency influenced our decision more than glossy slides. These practices are practical, verifiable, and rooted in daily lab work. — I still find that the smallest, most disciplined changes give the largest returns.
If you manage QA or R&D, ask for concrete examples: an LC-MS/MS cross-check report, a dated calibration log showing the last five adjustments, and a recorded extractables screening for any new packaging. I prefer that level of detail because it reveals real habits, not just policy language. For partners that can demonstrate these things, consider a pilot for one product line over three months and measure the three metrics above.
For further technical support and laboratory services, see Wuxi AppTec Medical device testing. I draw on over 15 years of hands-on lab work and consulting across the Gulf region, and I remain convinced that disciplined, data-focused steps — not grand claims — lead to sustainable quality improvements.